Python 性能分析

Contents
参考几种性能分析的方式。事例代码如下:
| |
暴力(time)性能分析
最简单的性能分析方式,使用系统命令 time,或者python中的 timeit、time 模块。
使用 time 方式:
| |
整体用时 0.622s。
使用python模块的方式:
| |
输出:
| |
上面的方式都比较原始,可大致看出程序的耗时,以及某段代码的耗时,但对于细粒度的具体耗时情况,就没有那么细了。
栈(cProfile)性能分析
cProfile 模块是性能分析模块,实际上是继承了标准库 _lsprof.Profiler,对标准库的输出做了一层封装,能够更直观的查看结果。
使用标准库 _lsprof.Profiler 进行性能分析:
| |
使用 cProfile 模块进行性能分析,结果就更加直观了:
| |
整体用时 1.271s,一共进行了 7049216次 函数调用,其中原生函数调用 94次,其余的函数调用为递归或者重复调用。
title名解释:
- ncalls - 函数调用次数,7049123/31 表示,7049123 次调用,31 次为原生调用,剩余的为重复调用。
- tottime - internal time,内部耗时,给定函数的所有执行时间(排除了子函数执行时间)
- percall - tottime/ncalls,单次调用所耗时间,除的是所有调用次数
- cumtime - cumulative time,累计时间,所有执行时间,包括子函数
- percall - cumtime/ncalls,单次调用所耗时间,除的是不重复调用次数
- filename:lineno - 文件名:行号(函数名)
cPorfile 模块中的 profile.print_stats 方法调用了 pstats 模块。该模块是专门用于打印 profile 输出文件。
| |
- strip_dirs - 方法会去除文件夹路径
- sort_stats
- 排序,以关键字进行排序
- 关键字包含很多,程序中对title中的字符进行了切割作为关键字,例如 cumulative time 的关键字可以是 cumulativ、cumulati、cumu
- 一般使用title中的名字即可
- 也支持多个关键字排序,如 sort_stats(“cumtime”, “filename”)
- print_stats
- 打印结果,带过滤功能,输入参数可以是函数名关键字,或者数字,也可以是两者的组合
- 数字可以是整数(int, long),表示打印排序后,第几位之前的内容
- 也可以是小数形式(float),表示输出整个结果的前面百分比,如 0.1 表示输出前面10%的内容
- 函数名和数字的前后关系,会导致结果的不同
- print_stats(“fib”, 0.5) - 输出包含 fib 的函数的前50%的内容
- print_stats(0.5, “fib”) - 输出前50%内容,其中函数名中需要包含 fib
- 打印结果,带过滤功能,输入参数可以是函数名关键字,或者数字,也可以是两者的组合
(注:其他的一些函数,如 print_callees、print_callers 使用类似)
| |
通过 cProfile 模块进行性能分析,主要是通过其产生 profile 文件(当然也可以直接打印结果),后续通过 pstats 模块进行解析,输出结果。
其他的一些 类cProfile 模块也是通过类似的方式进行性能分析,例如 line_profile、memory_profile 分别进行了函数行执行性能分析以及内存性能分析。
以上的方式,都是通过注入(hook)的方式,通过函数正常执行时,加入回调函数来实现时间的统计,或多或少的 会影响原生函数执行的性能。例如未使用cProfile模块时,函数的整体执行时间只有 0.6s,使用之后为 1.2s。这是函数递归调用过多造成的结果。
性能分析的结果,与实际的结果可能存在些许出入,但整体的时间使用分布能够客观反映。
可视化性能分析
gprof2dot
需要安装 gprof2dot 以及 graphviz
| |
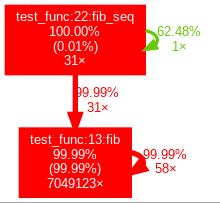
使用 gprof2dot 程序将各种性能分析的结果文件转换,再通过 dot 程序将转换后的结果 输出为各类格式的结果保存。
| |
如上的命令,将 pstats 类型的 cProfile 分析结果转换,再通过 dot 程序输出为jpg文件。最终的输出结果图片如下:
vprof
需要安装 vprof
| |
使用 vprof 可以通过 -c 参数将程序按几种类型进行性能分析,包括 cpu、profile、memory graph、code heatmap。可以单独使用,也可以结合使用。
| |
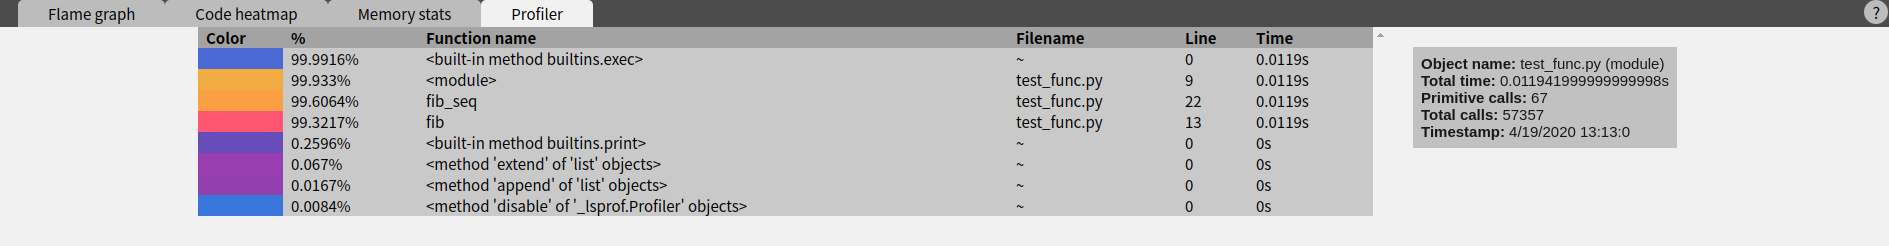
官方示意图:
pyprof2calltree
需要安装 pyprof2calltree 以及 kcachegrind
| |
使用 pyprof2calltree 将 cProfile 分析的结果文件,进行转化
| |
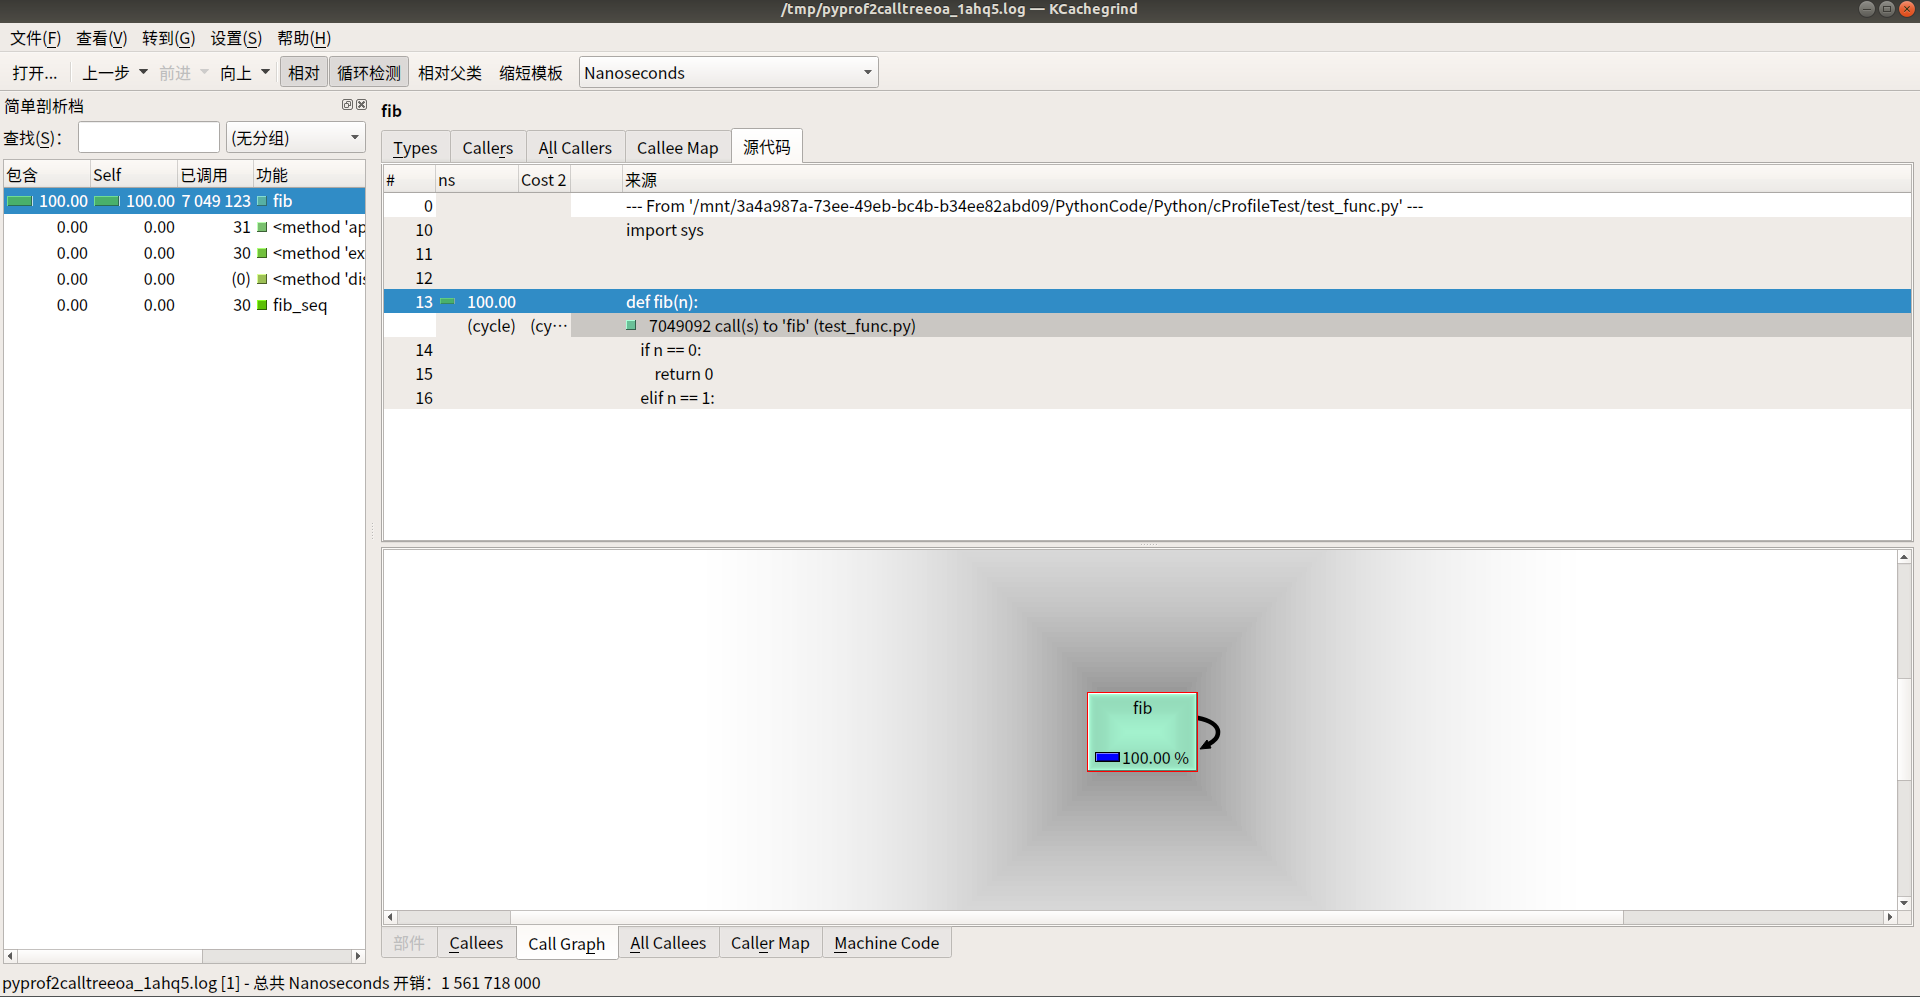
以上可视化工具都是对一些输出结果做的可视化,显示的更加直观,虽然很炫酷,但个人还是更喜欢直接查看prof文件的方式。
第三方工具
Application Portfolio Management (APM, 应用性能管理),国外厂商 NewRelic 和 AppDynamics,国内厂商 OneAPM。